KYC/B Analytics Dashboard
Track verification volume, approval rates, decision mix, processing time, and risk-score distribution using the Certivant Analytics dashboard.
What it does
The Analytics page aggregates your KYC and KYB verification activity into charts — daily trends, approval rate, risk distribution, document-type breakdowns, country mix. It's the answer to "how is verification going this week / this month / this quarter?"
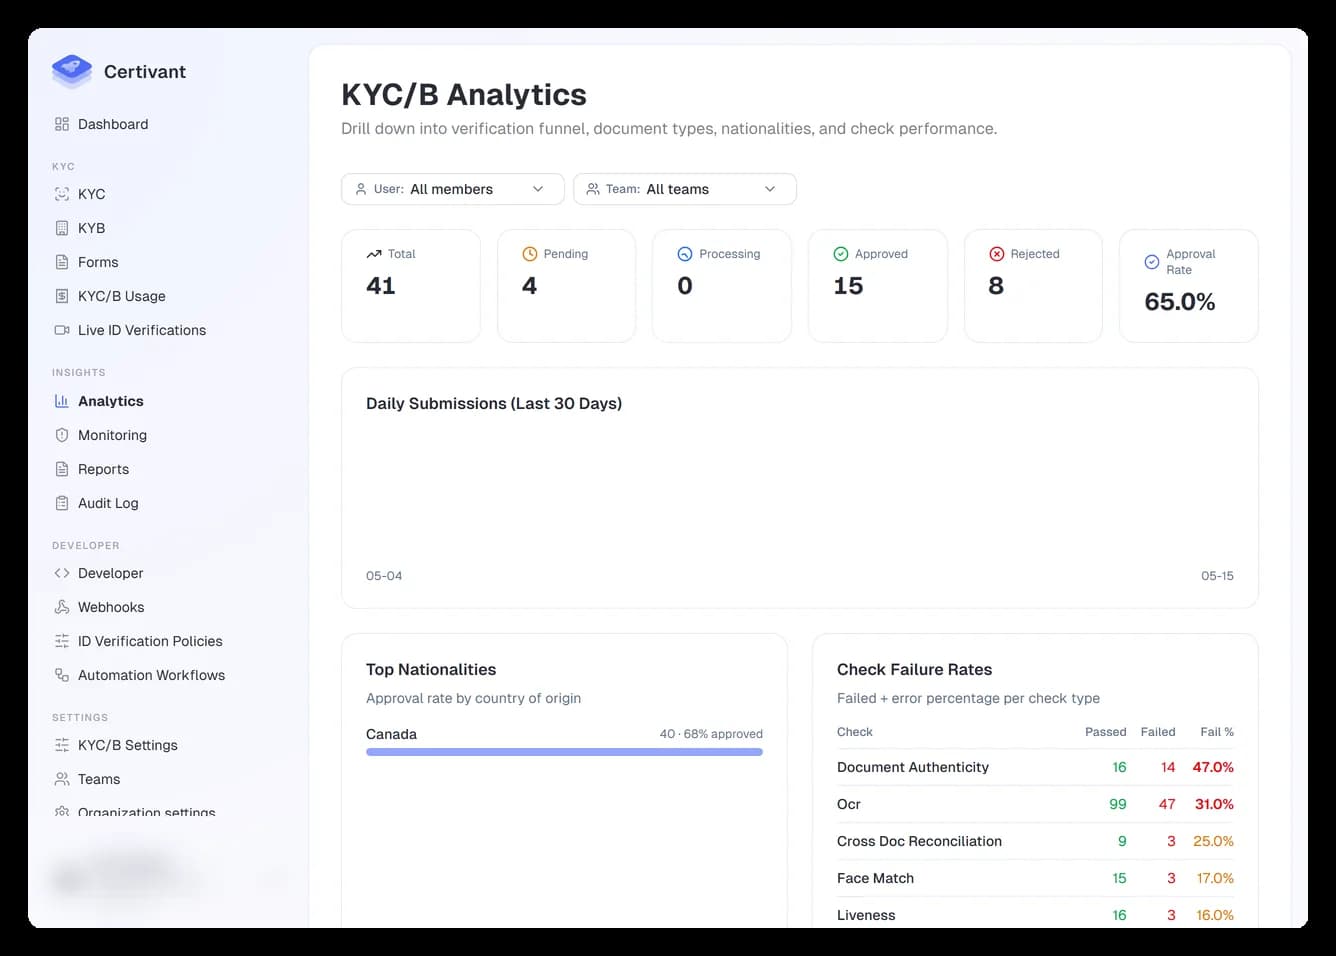
Where it lives
Insights → Analytics in the left sidebar.
What you'll see
Header
The top of the page has these controls:
- Tabs — switch between KYC and KYB. Counts and charts re-load.
- Date range picker — pick a from/to. Defaults to the last 30 days.
- Owner/team filter — admins only. Filter to a specific user or team.
- Sub-tenant filter — partner orgs only. Appears once any request is tagged with a sub-tenant; narrows every chart to one of your end customers. (See partner attribution.)
Top-line cards
Four KPI cards above the charts:
| Card | What it shows |
|---|---|
| Verifications | Total submitted in the period. With a small delta vs. the previous period. |
| Approval rate | % of completed verifications that ended in APPROVED. Green if up vs. previous period, red if down. |
| Avg processing time | Median time from PENDING_UPLOAD to a final decision. Lower is better. |
| Auto-decisions | % of decisions that were automatic vs. manually overridden. High is good — it means your thresholds are tuned. |
Daily trend chart
Stacked area chart showing daily volume, split by decision: auto-approved (green), auto-rejected (red), escalated (amber), manual-approved (dark green), manual-rejected (dark red). Hover for tooltips. The chart's x-axis follows the date-range picker.
Use this to:
- Spot weekly cycles (lots of weekend applicants? Monday-morning catch-up?).
- Catch sudden spikes (a marketing push? A bot attack?).
- See whether your escalation queue is growing — escalated bars accumulate at the top.
By Document Type
Pie chart showing what kinds of IDs your applicants submitted. Typically dominated by driver's licenses + passports. Watch this if you're considering removing a document type — make sure no significant share depends on it.
By Nationality / Country
Bar chart showing where your applicants are from. Useful when expanding into new markets or restricting countries — you'll see immediately if applicants from countries you don't actually serve are slipping through.
Check failures
Which automated check most frequently fails. Common: face-match (selfie quality), document-authenticity (poor lighting on the ID), liveness (applicant didn't follow instructions). Use this to refine your applicant-facing instructions.
Risk-score distribution
Histogram of trust-scores assigned by our AI. Skewed left = lots of low-risk applicants (typical). Skewed right = lots of risky applicants — review your acquisition channels or your enabled checks.
Exporting
The Export button (top-right) produces a CSV with the raw counts per day per decision-type, scoped to your current filters. Useful for ad-hoc analysis in a spreadsheet.
Troubleshooting
"No data" on every chart
Either:
- Your date range has zero verifications. Widen it.
- You're filtered to a user/team with no activity. Clear the filter.
- You're a member without data-isolation access to the requests. The page shows only your accessible scope.
Approval rate is 100% but I expected lower
You're probably looking at a small sample (e.g. 3 of 3 approved). Widen the date range so the sample is statistically meaningful (200+ verifications recommended).
The chart shows yesterday but not today
Today's bar updates throughout the day. Refresh the page or hit the page's Refresh button to force a re-fetch.
Related
- Monitoring — ongoing alert-style checks, not period summaries.
- Reports — exportable scheduled reports.
- KYC/B Usage — billing-focused counts (each completed verification is billable).
Preview & publish a form
Test your Certivant form end-to-end in preview mode, publish it to the Send-request picker, share a public link, and roll out updates safely.
Ongoing Monitoring and AML Alerts
Continuously screen approved applicants for sanctions hits, adverse media, and PEP status changes using Certivant ongoing monitoring and the alert queue.